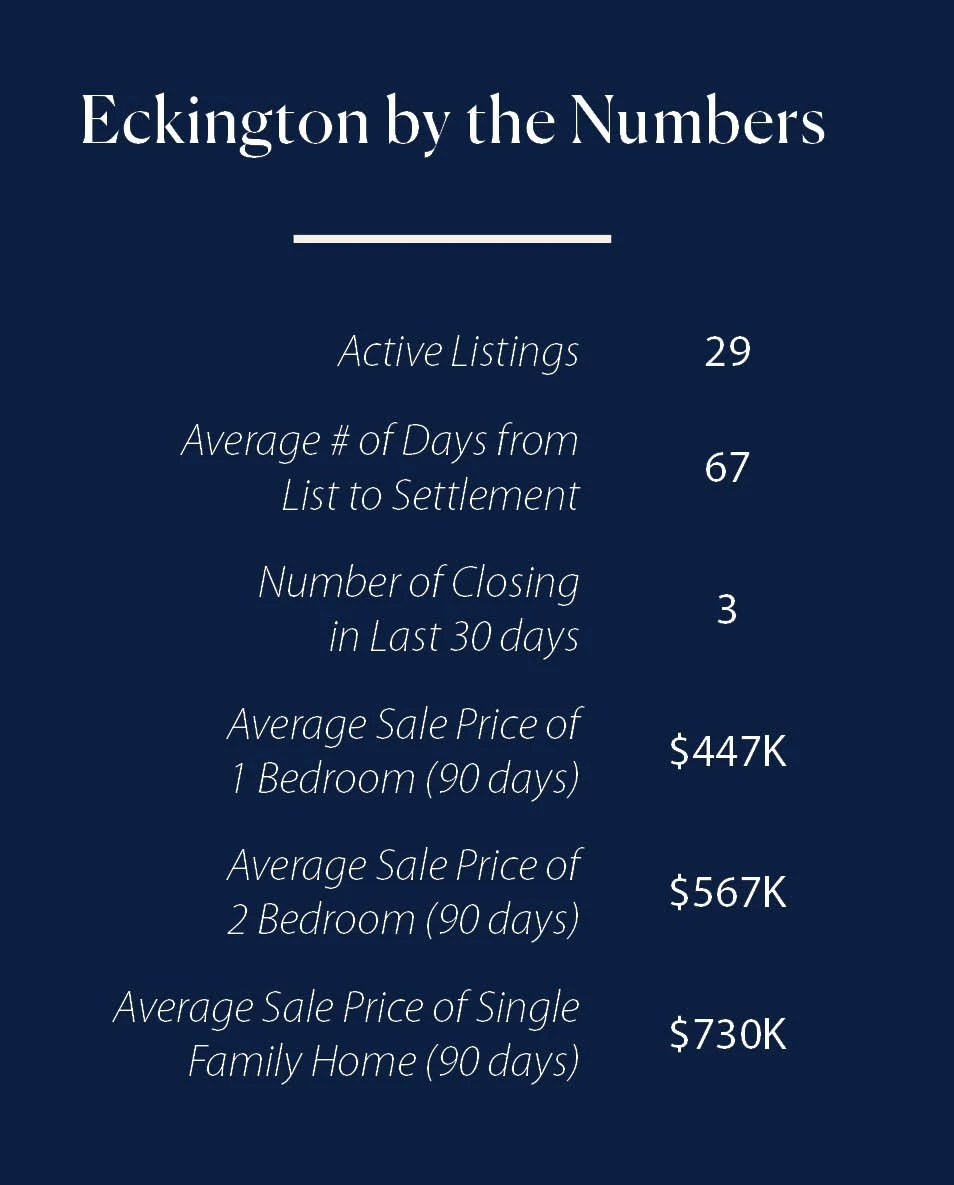
Eckington By The Numbers || Weekend 03.11.2023

Happy Sunday Eckington Neighbors!
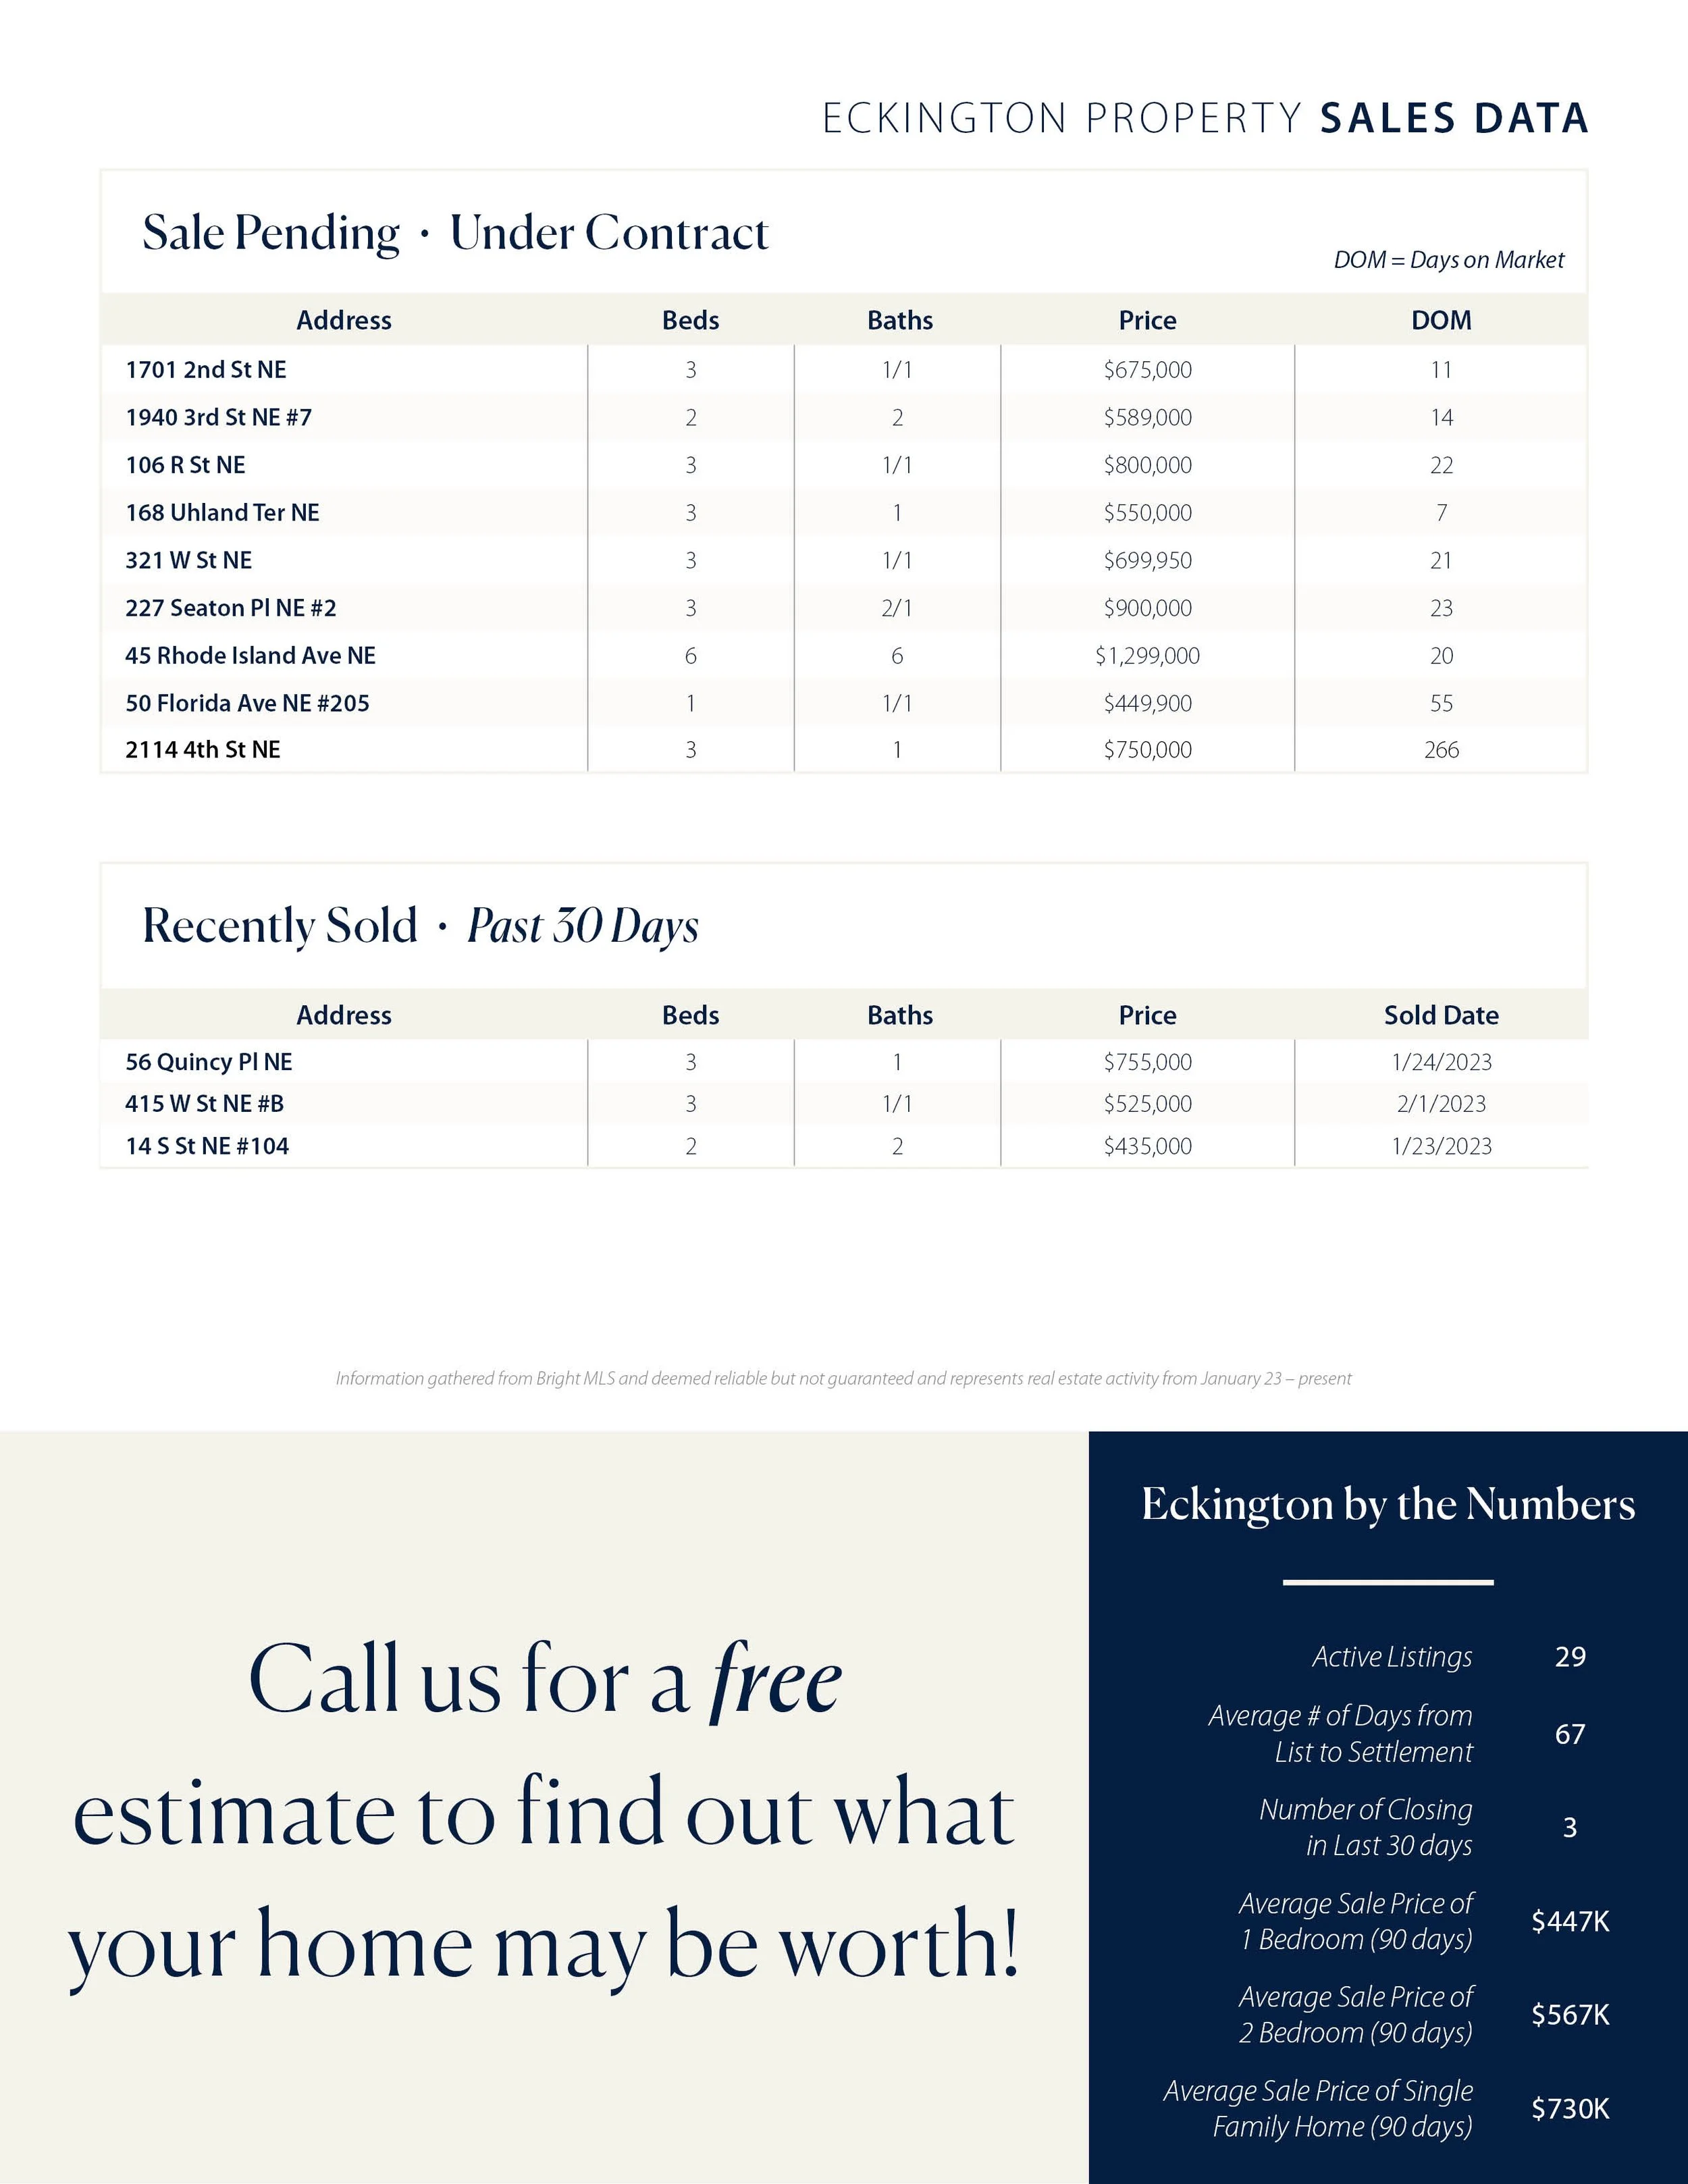
I hope everyone is having a nice weekend. Please see the summary real estate numbers below, the link to download the printable PDF of the Eckington Sales Tracker & Open House Guide and a link to see all Active listings.
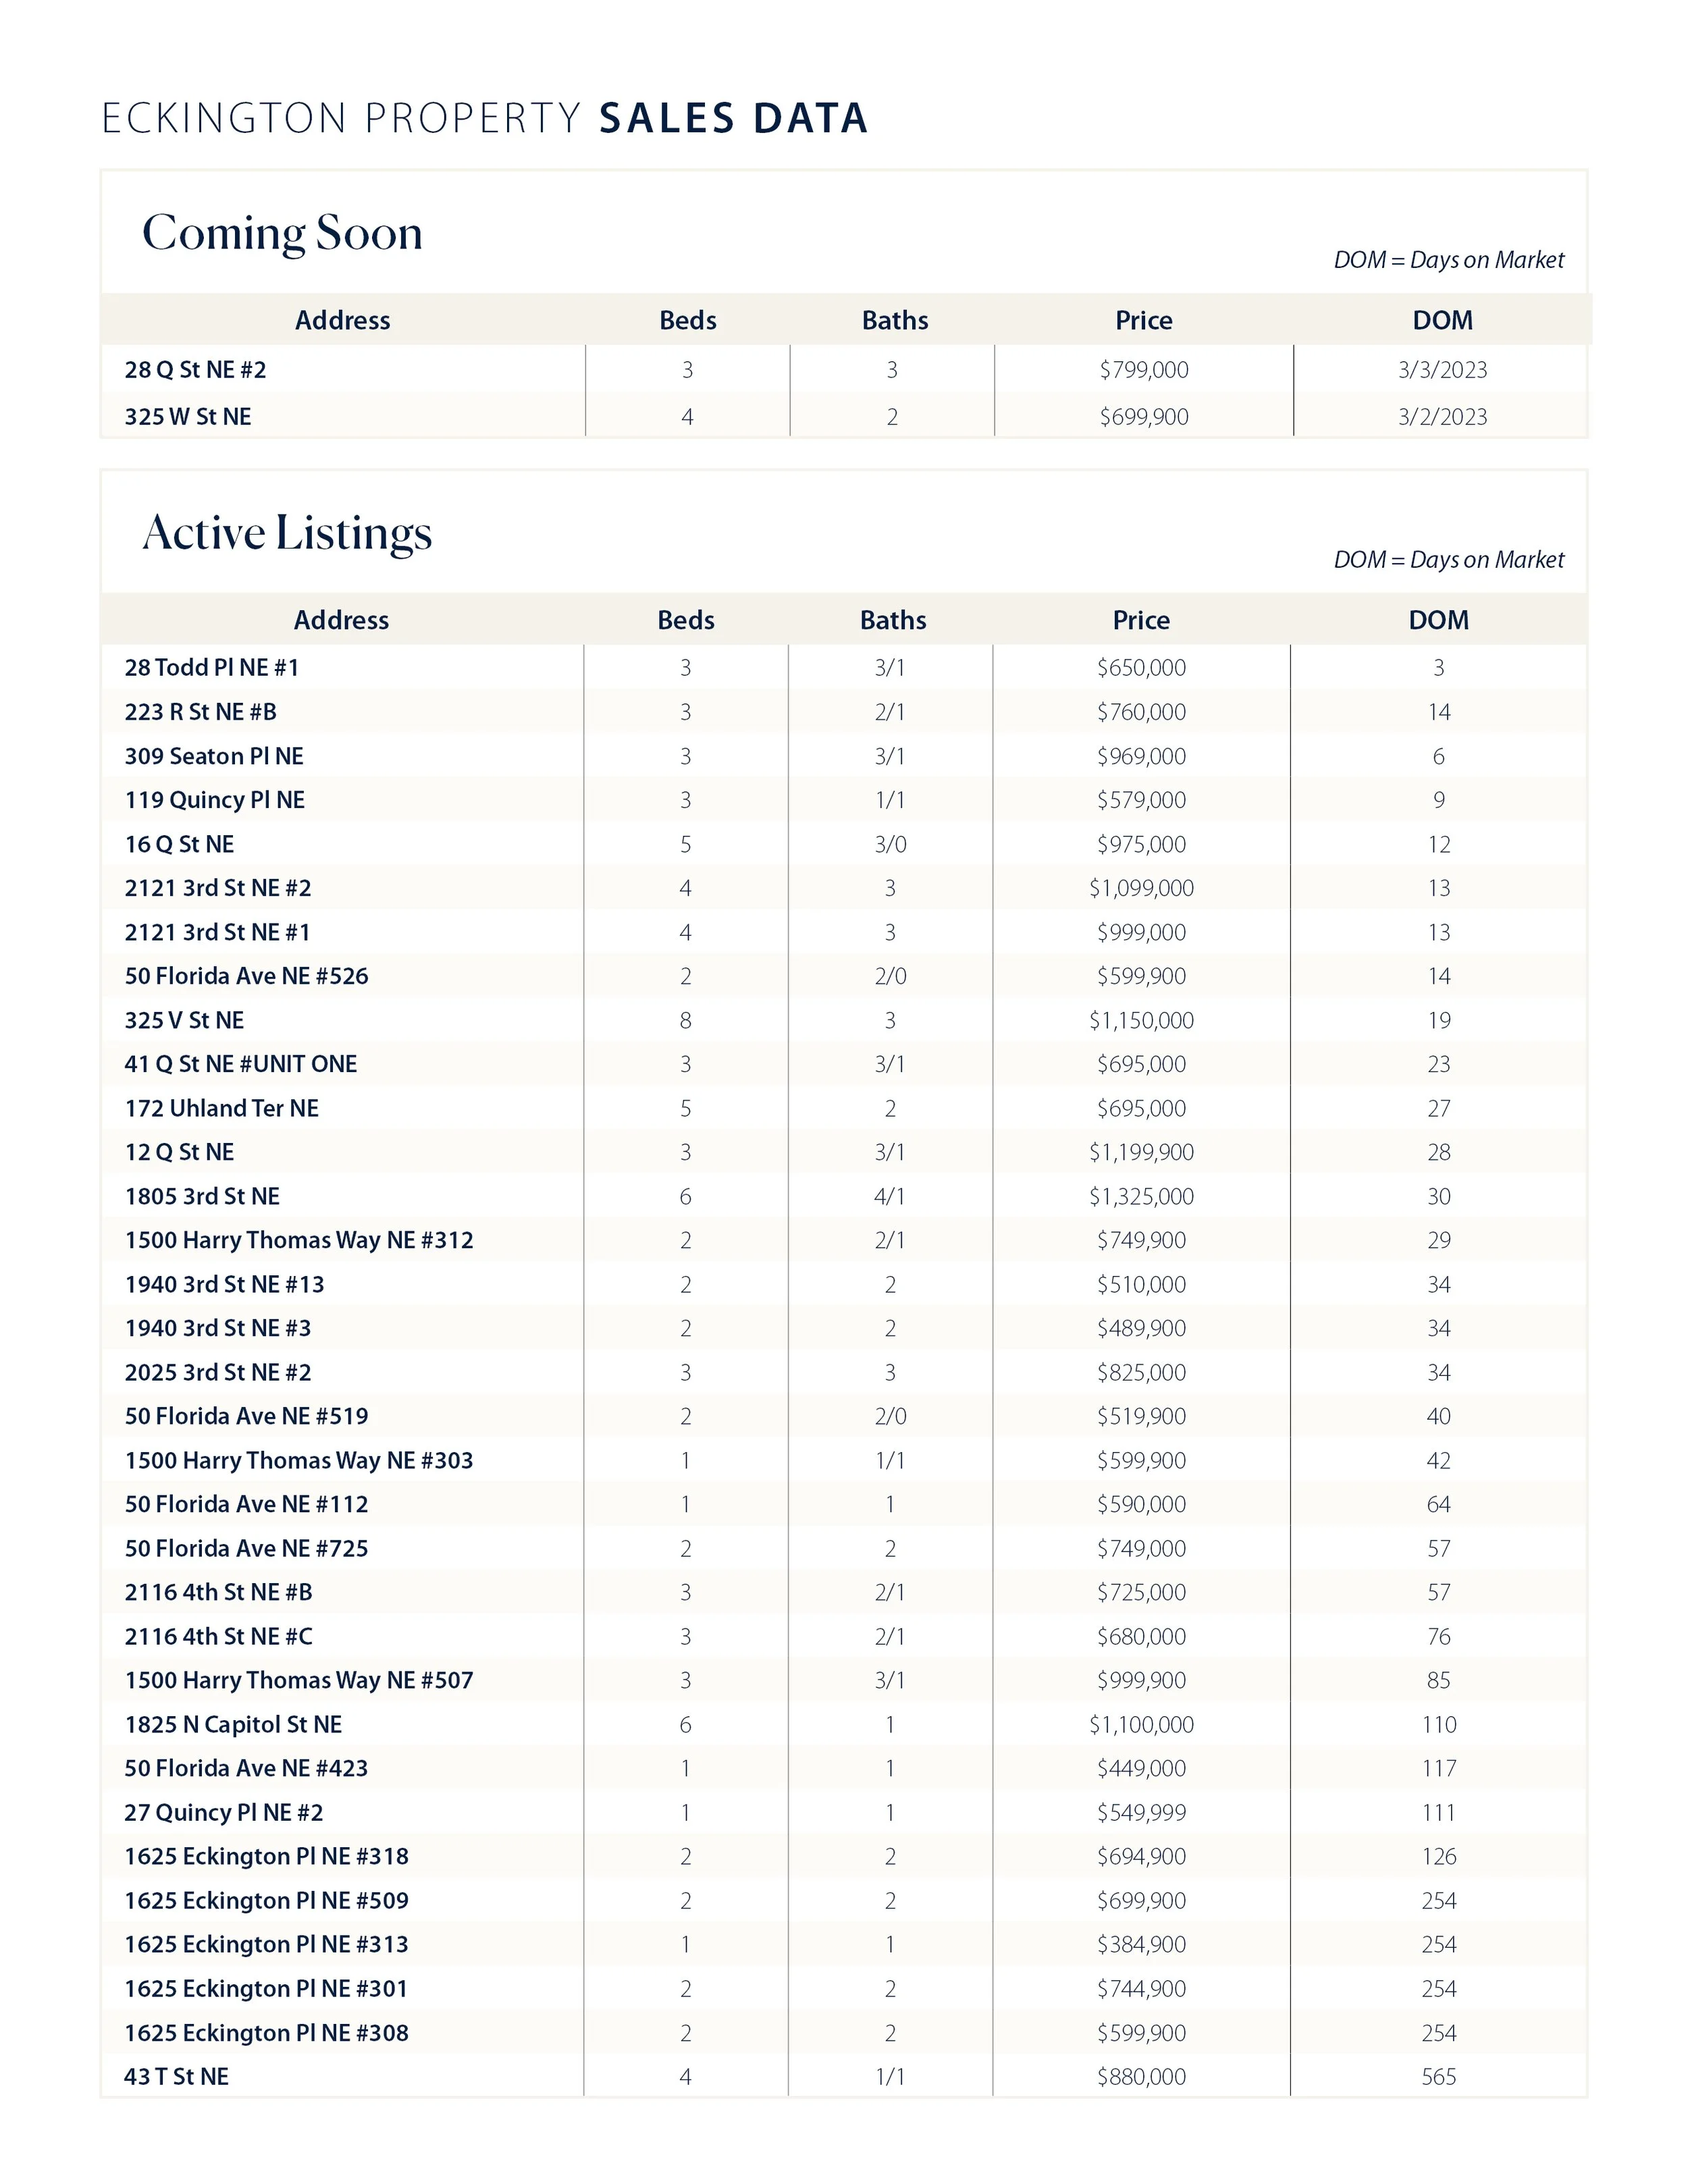
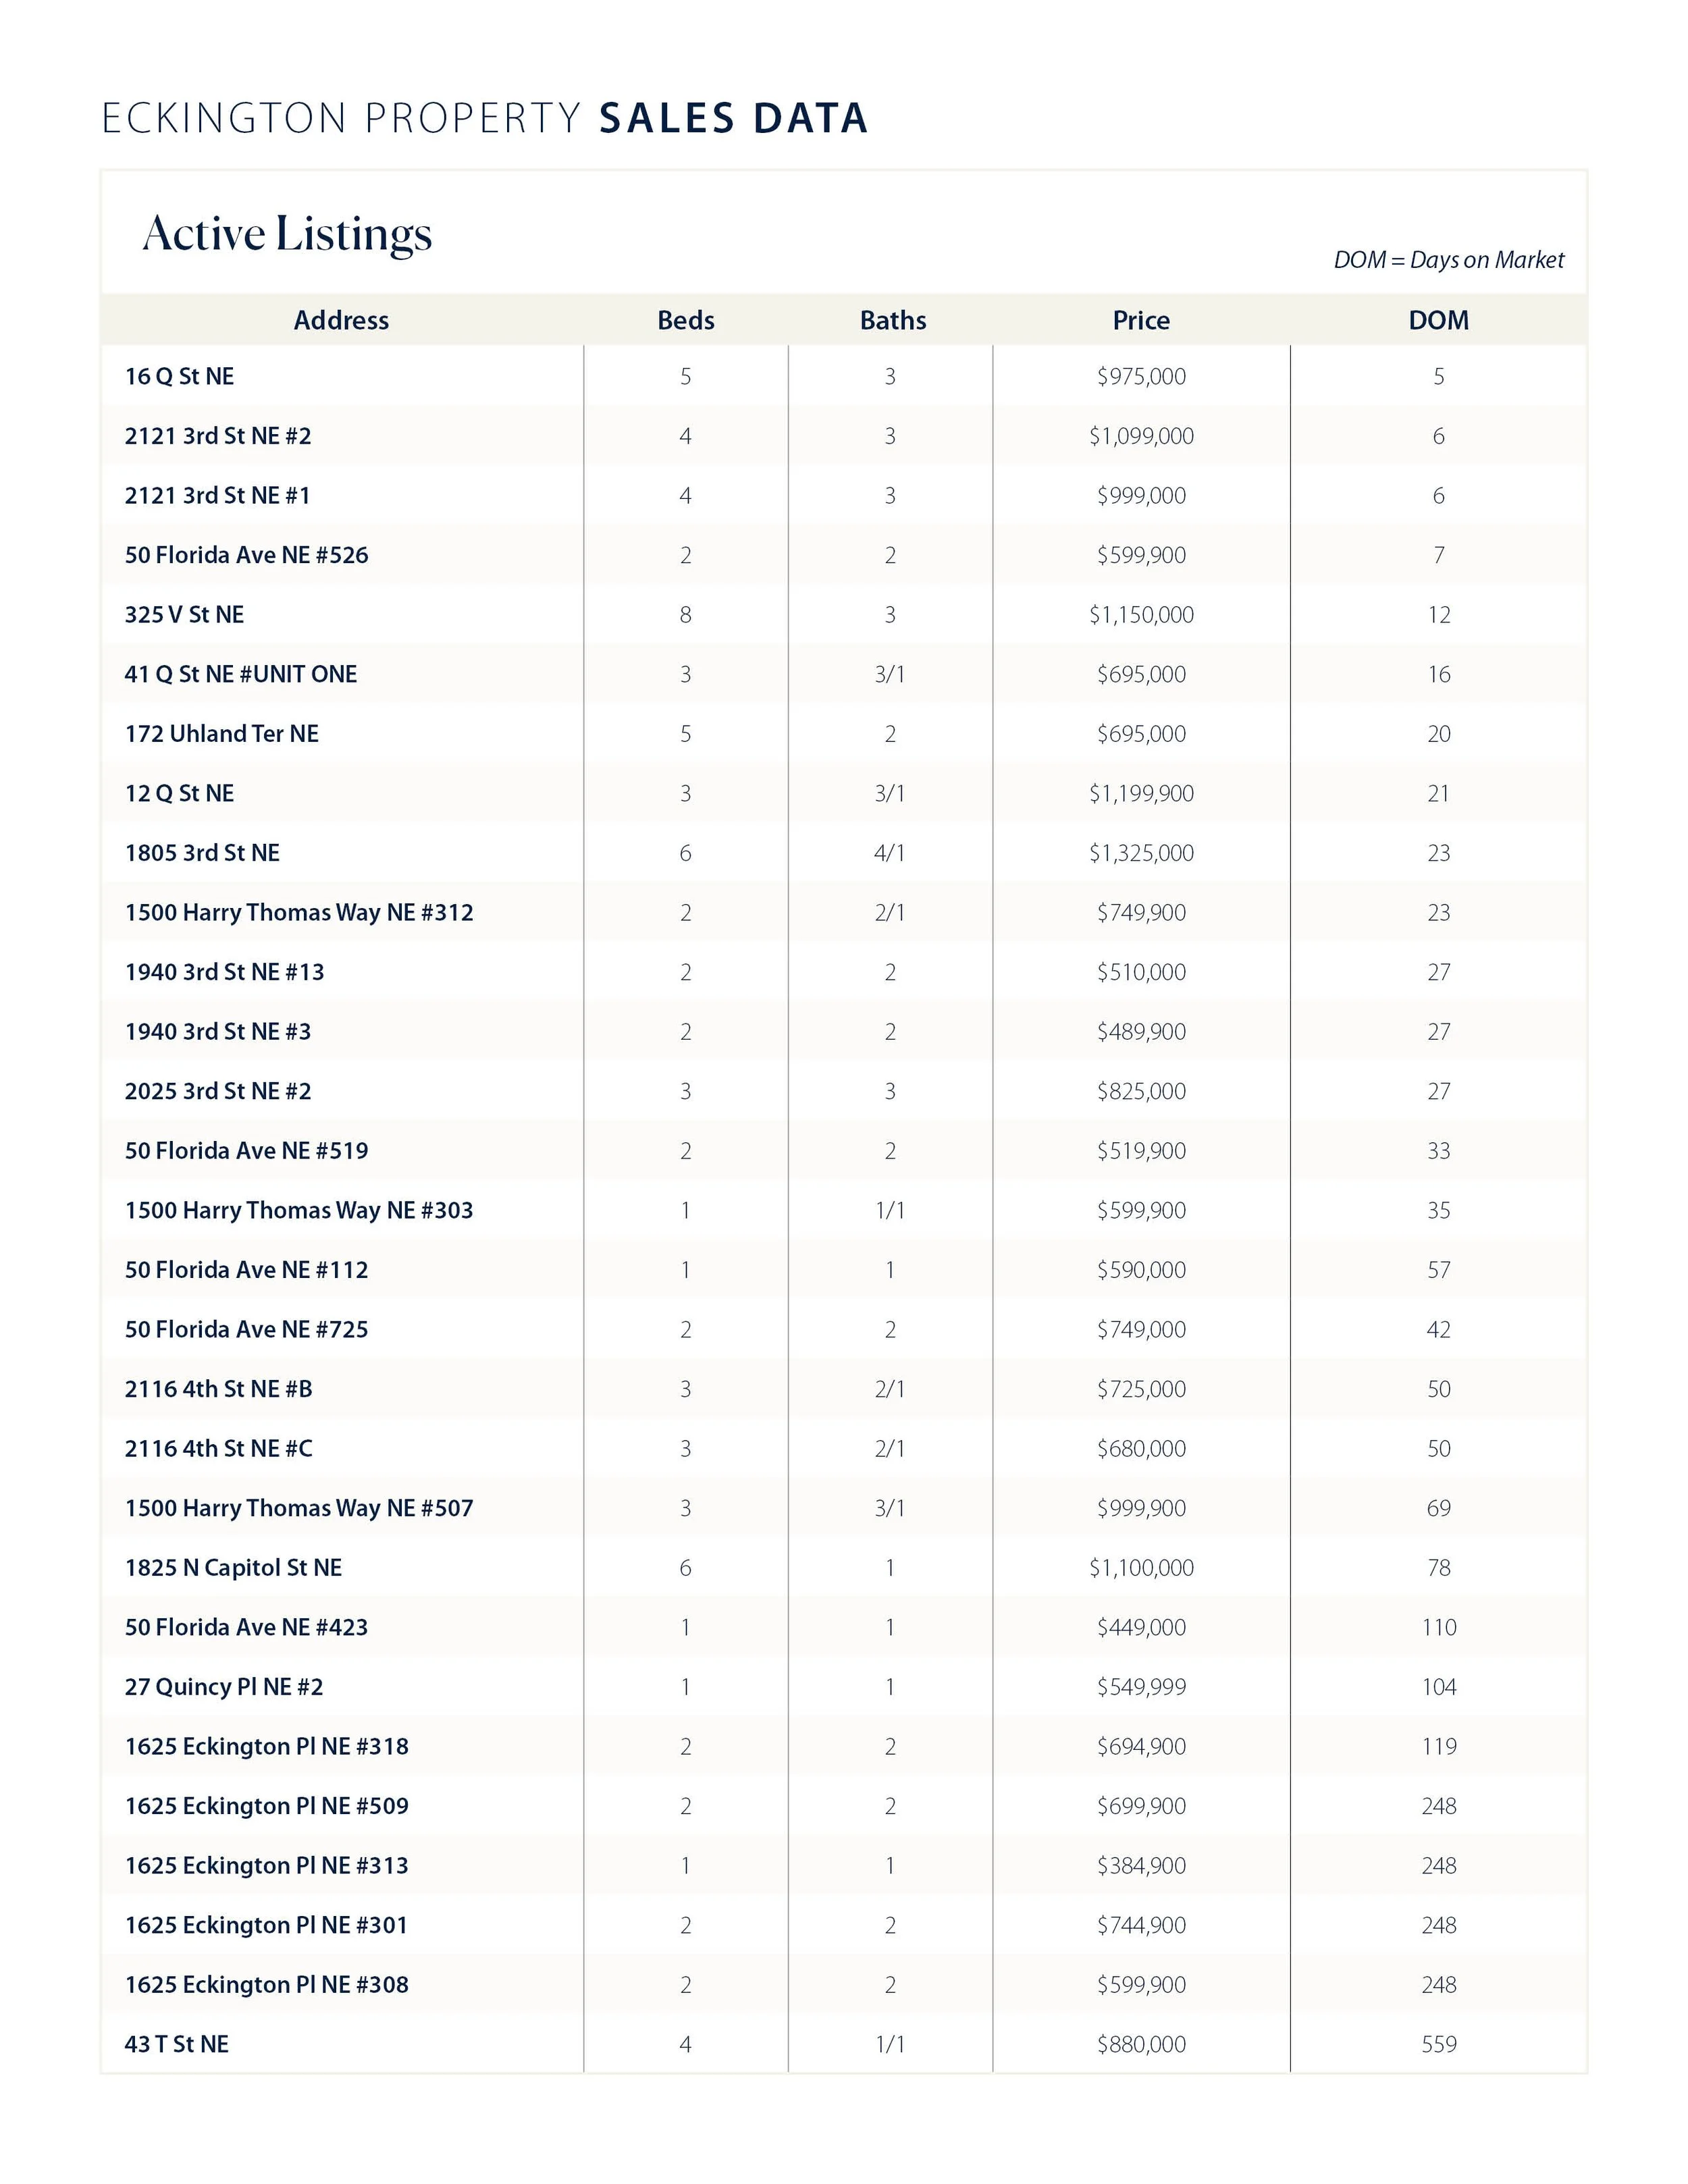
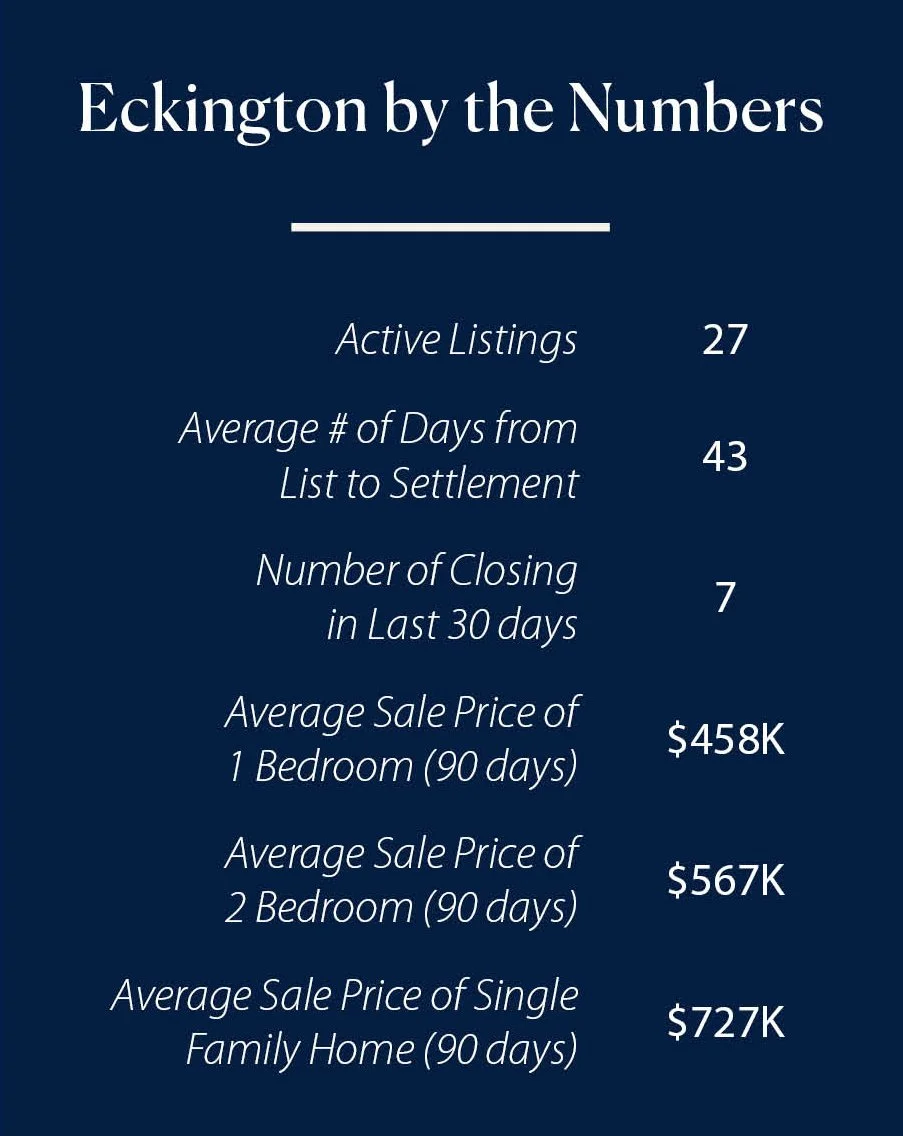
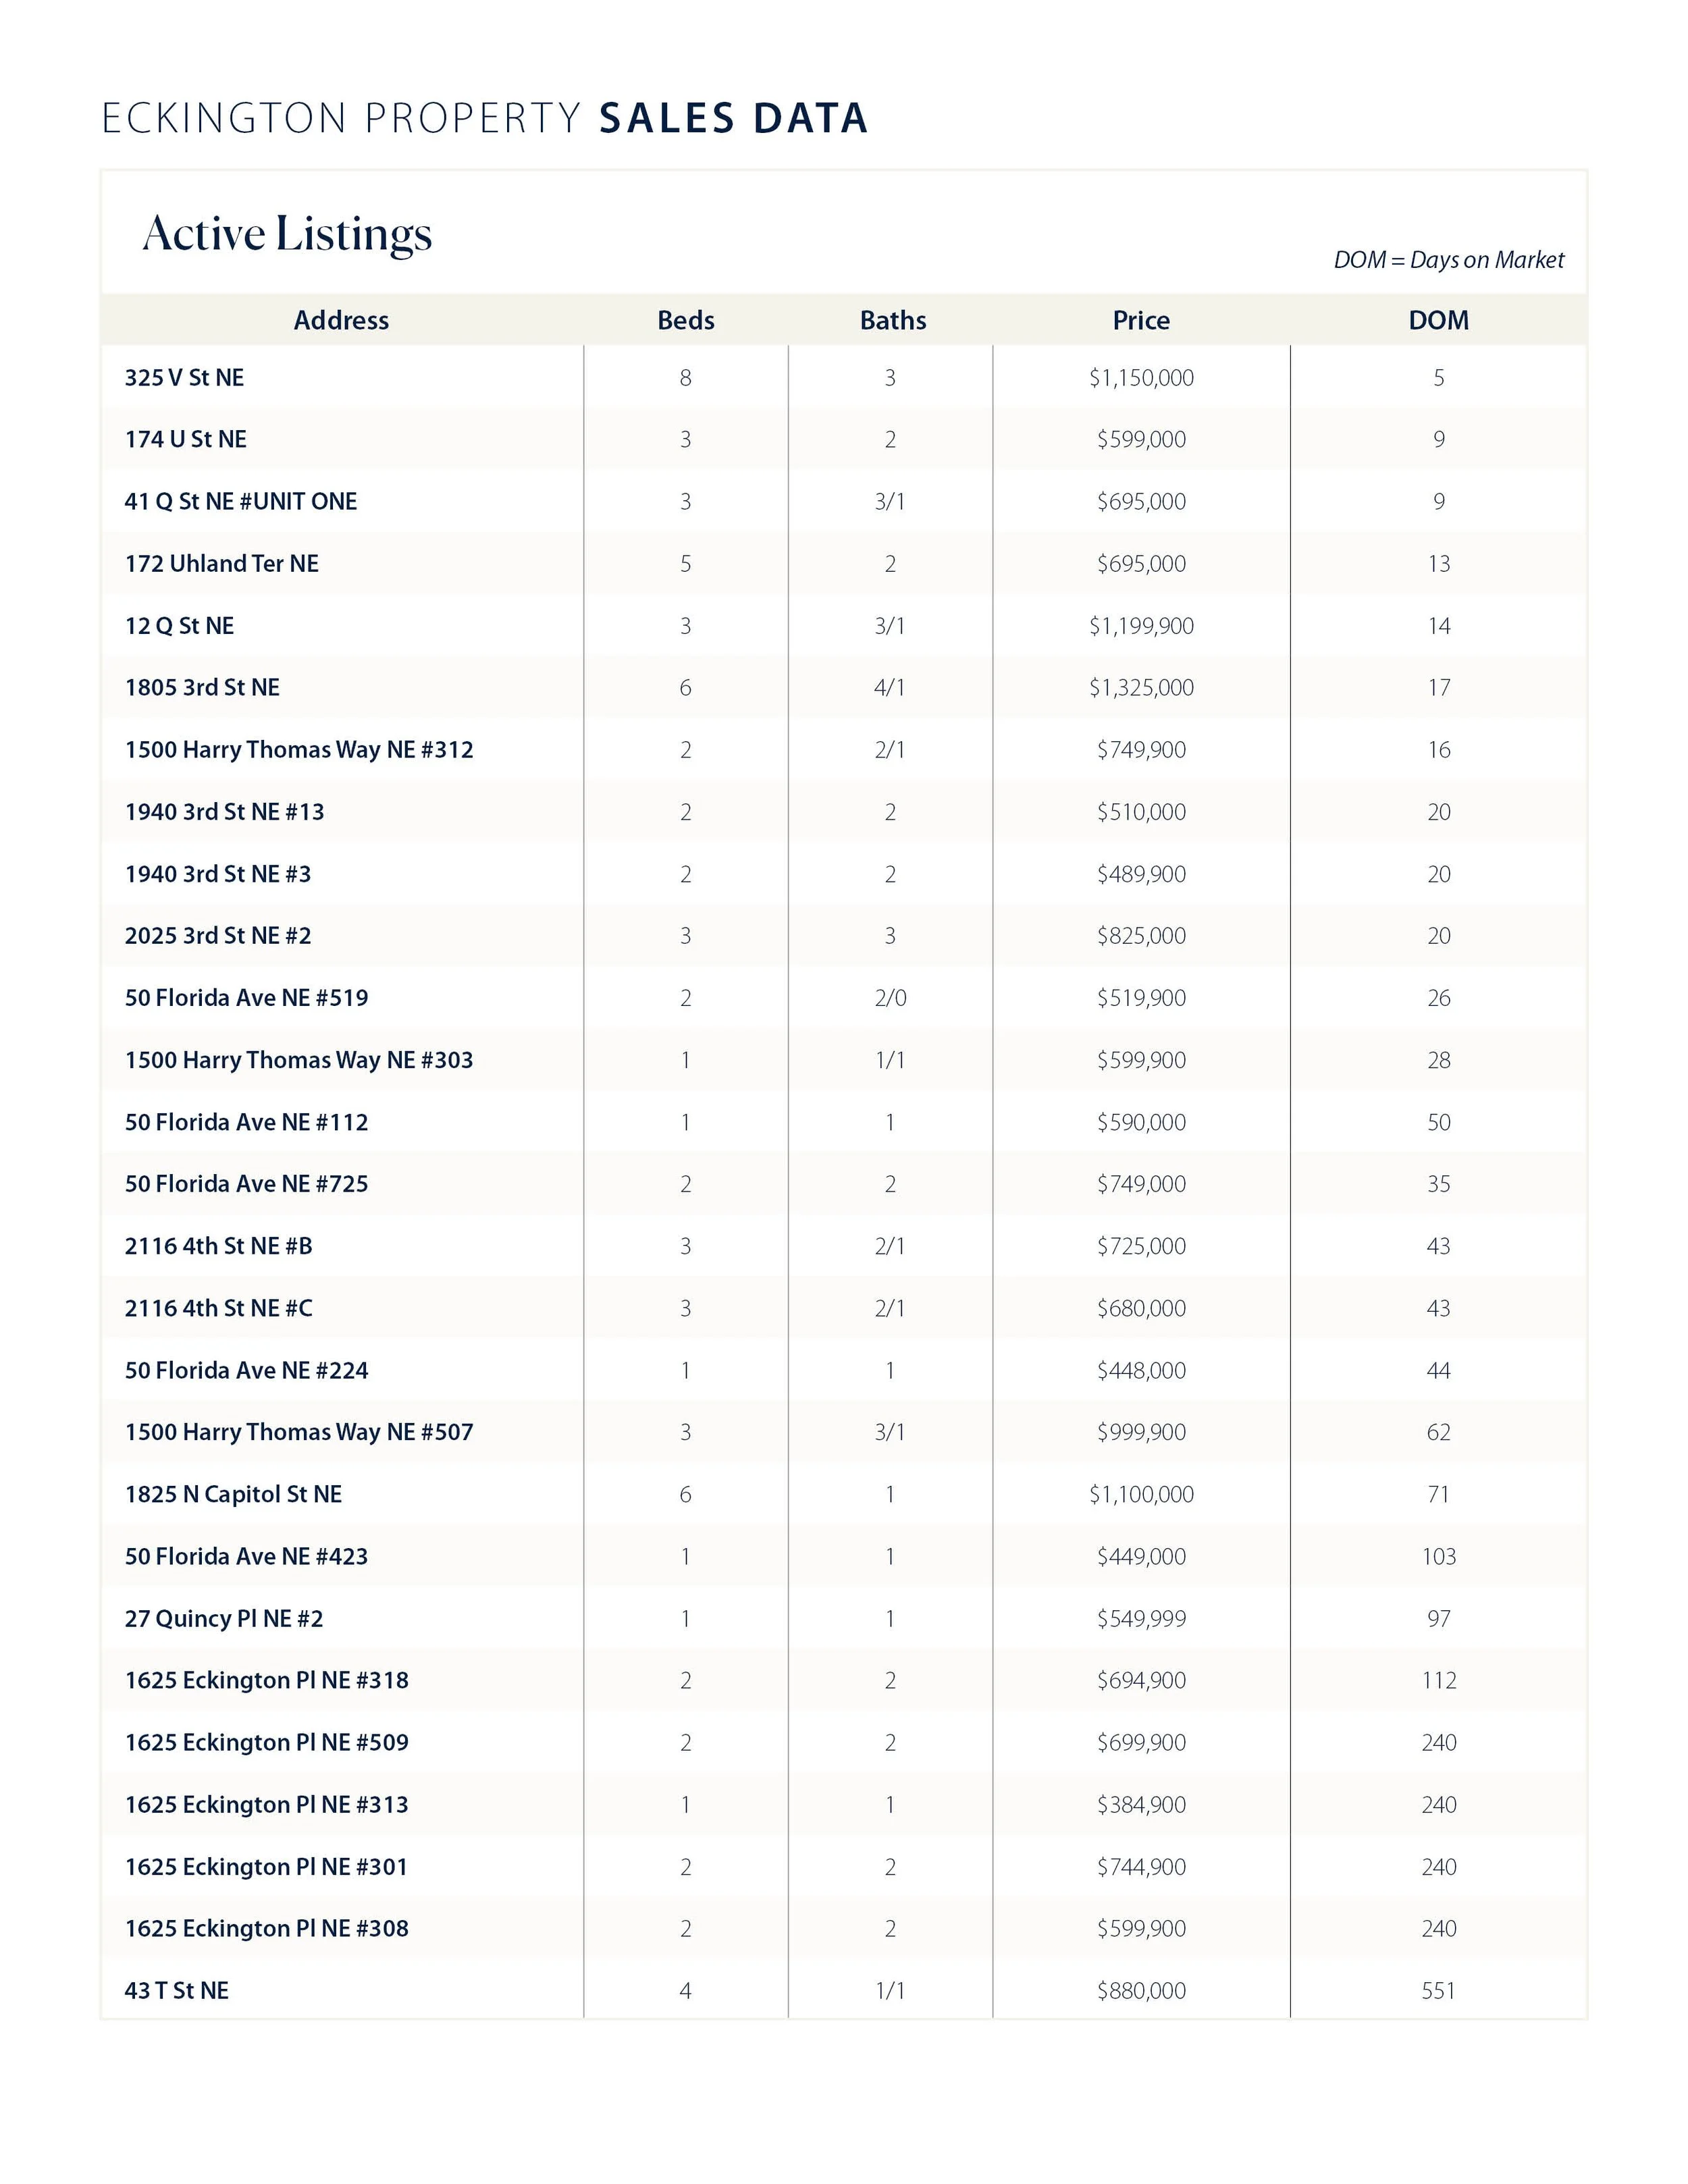
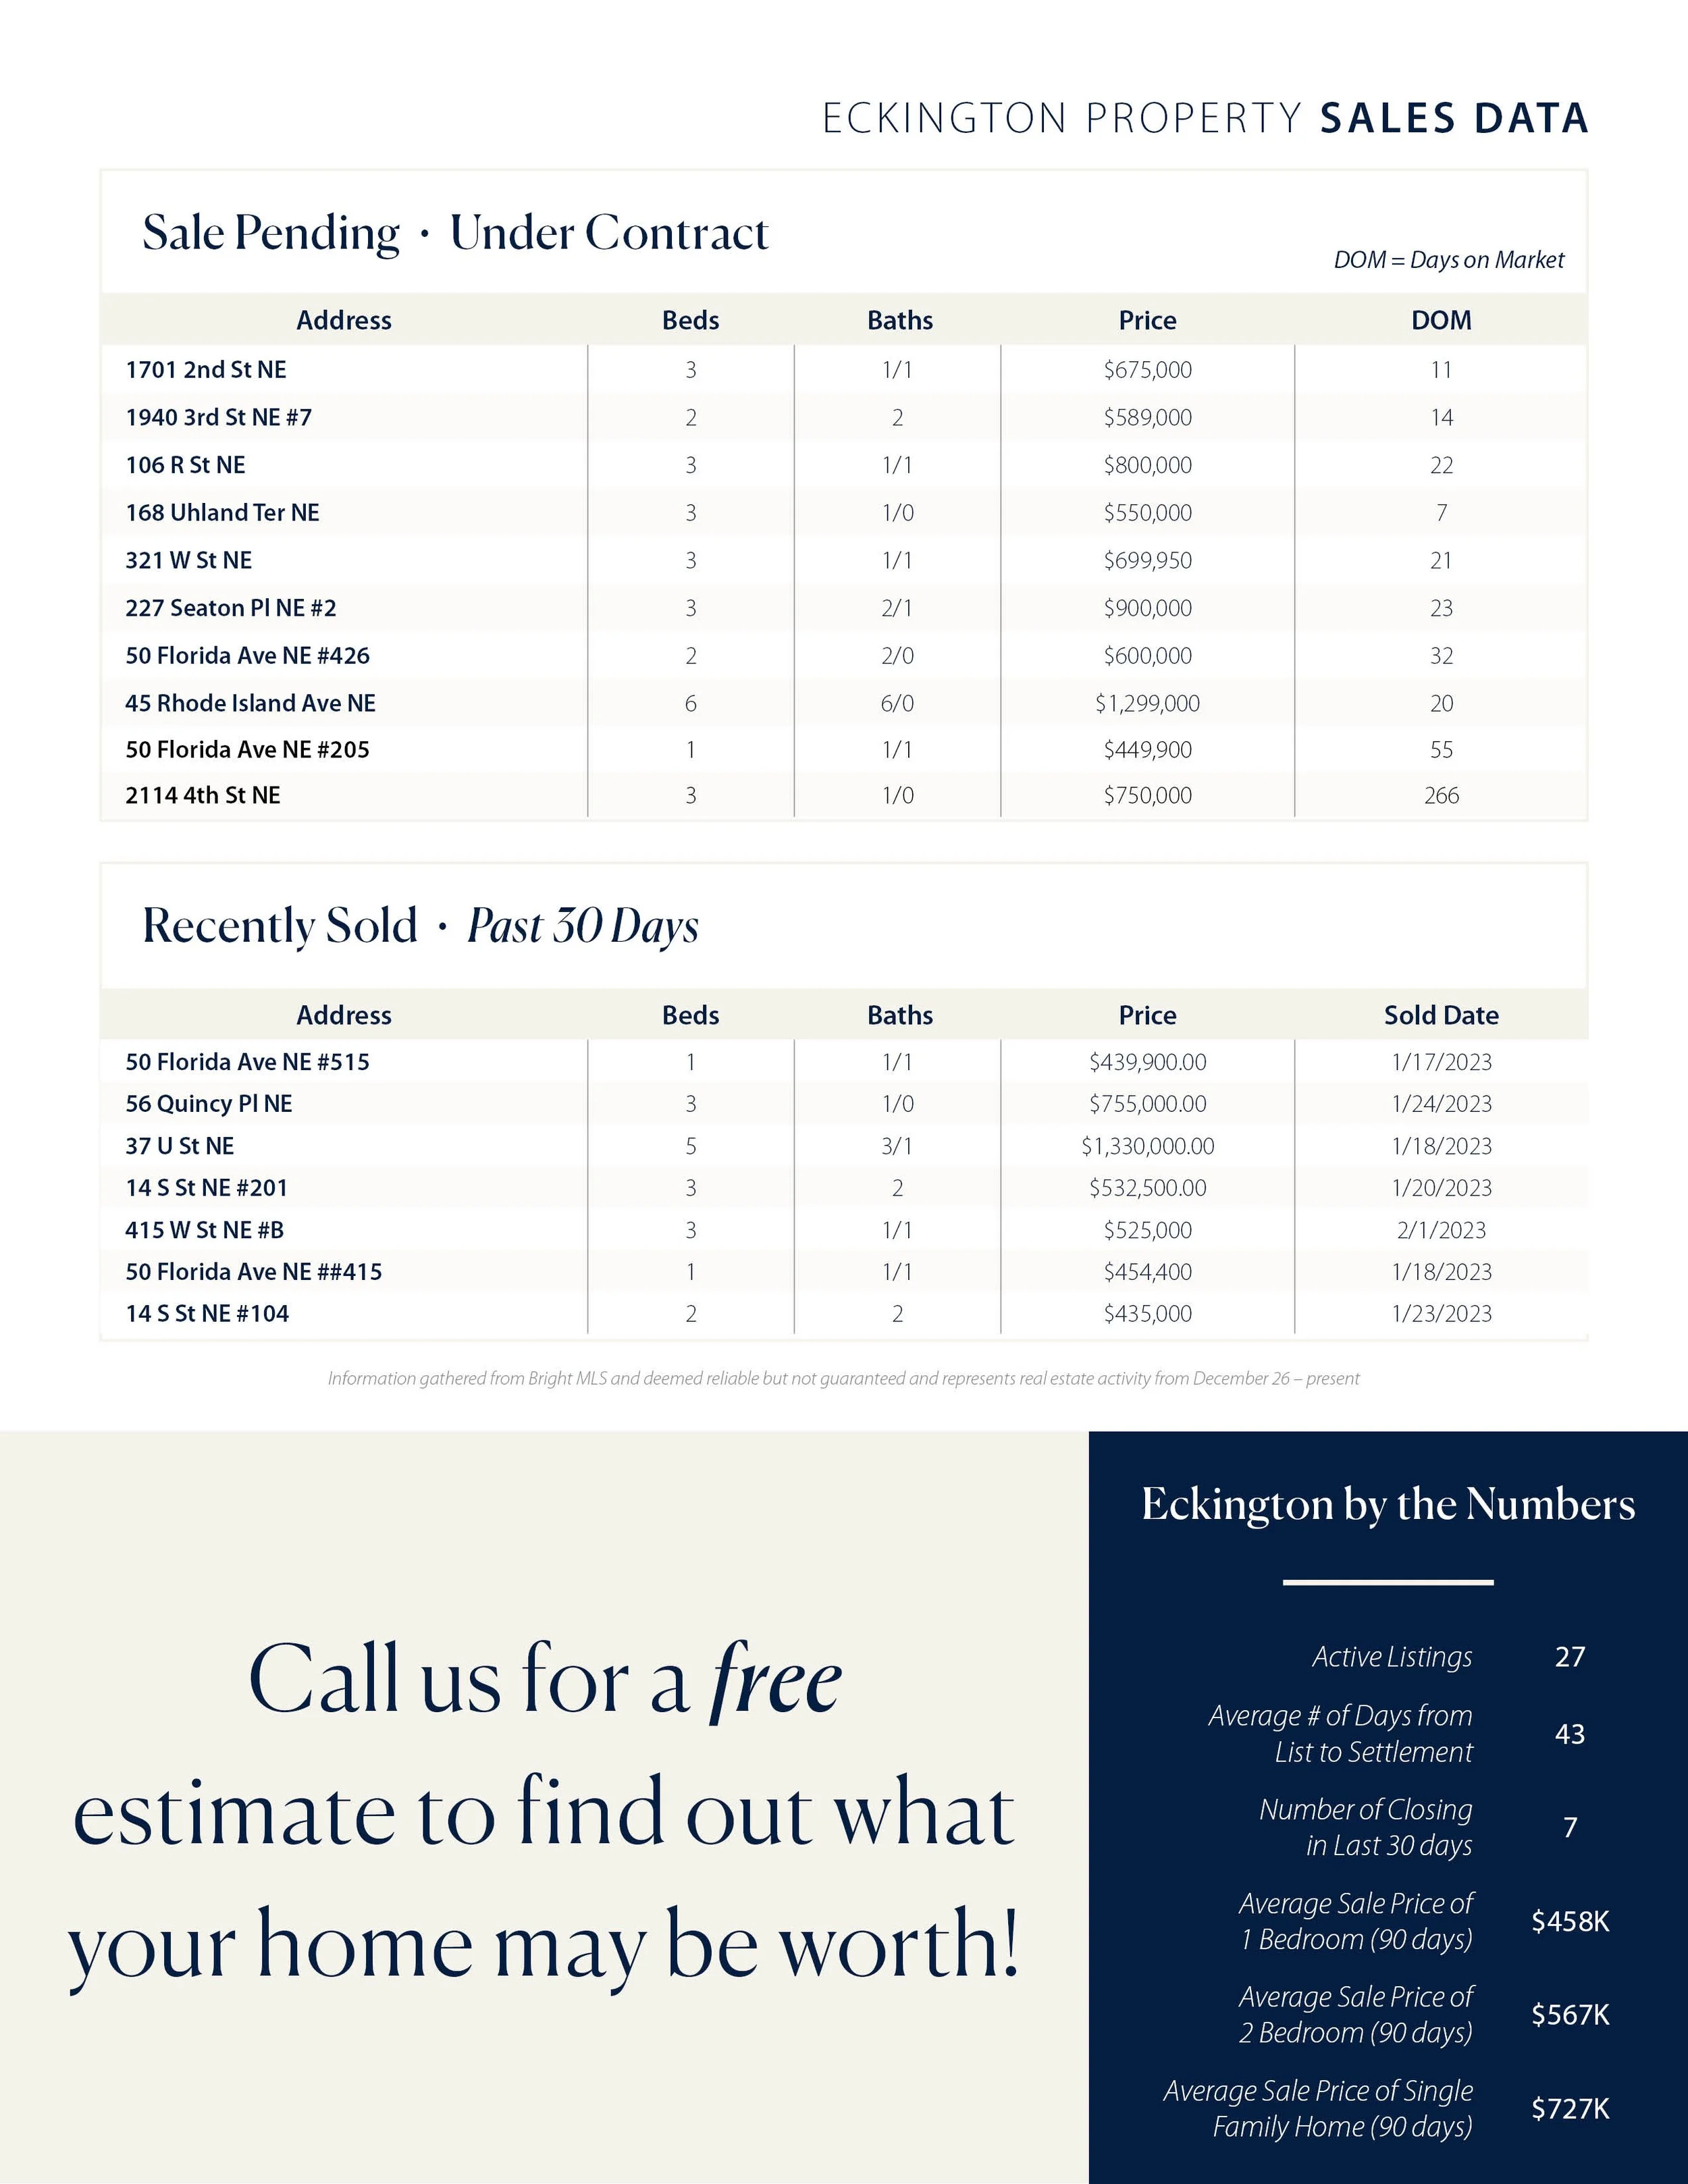
A few notes about the numbers this week. This week in Eckington the active listings went from 35 to 32 with 12 closings taking place in the last 30 days which is up from 7 closings last week. That means new listings are going active, moving off market and new stock is coming on. A decent sign for Sellers! This same 30 day period last year, we had 19 closings from February 10, 2022 to March 11, 2022. If you look at the sales tracker you will see, we now have several homes sitting on the market for more than 30, 60 and even 90 days. Once a home sits that long on the market it becomes stale. Most impactful to a successful sale, the home stops showing up in searches for buyers actively looking. This keeps reinforcing in my mind that coming gate properly placed on the market is your best bet to a sale that will get you the most money for your home.
30-year fixed rates went up for the fourth week in a row, from 6.45% to 6.65%. We know the Federal Reserve will be raising rates at least one more time in March but we are hopefully getting closer to the peak rate in their fight to control inflation.
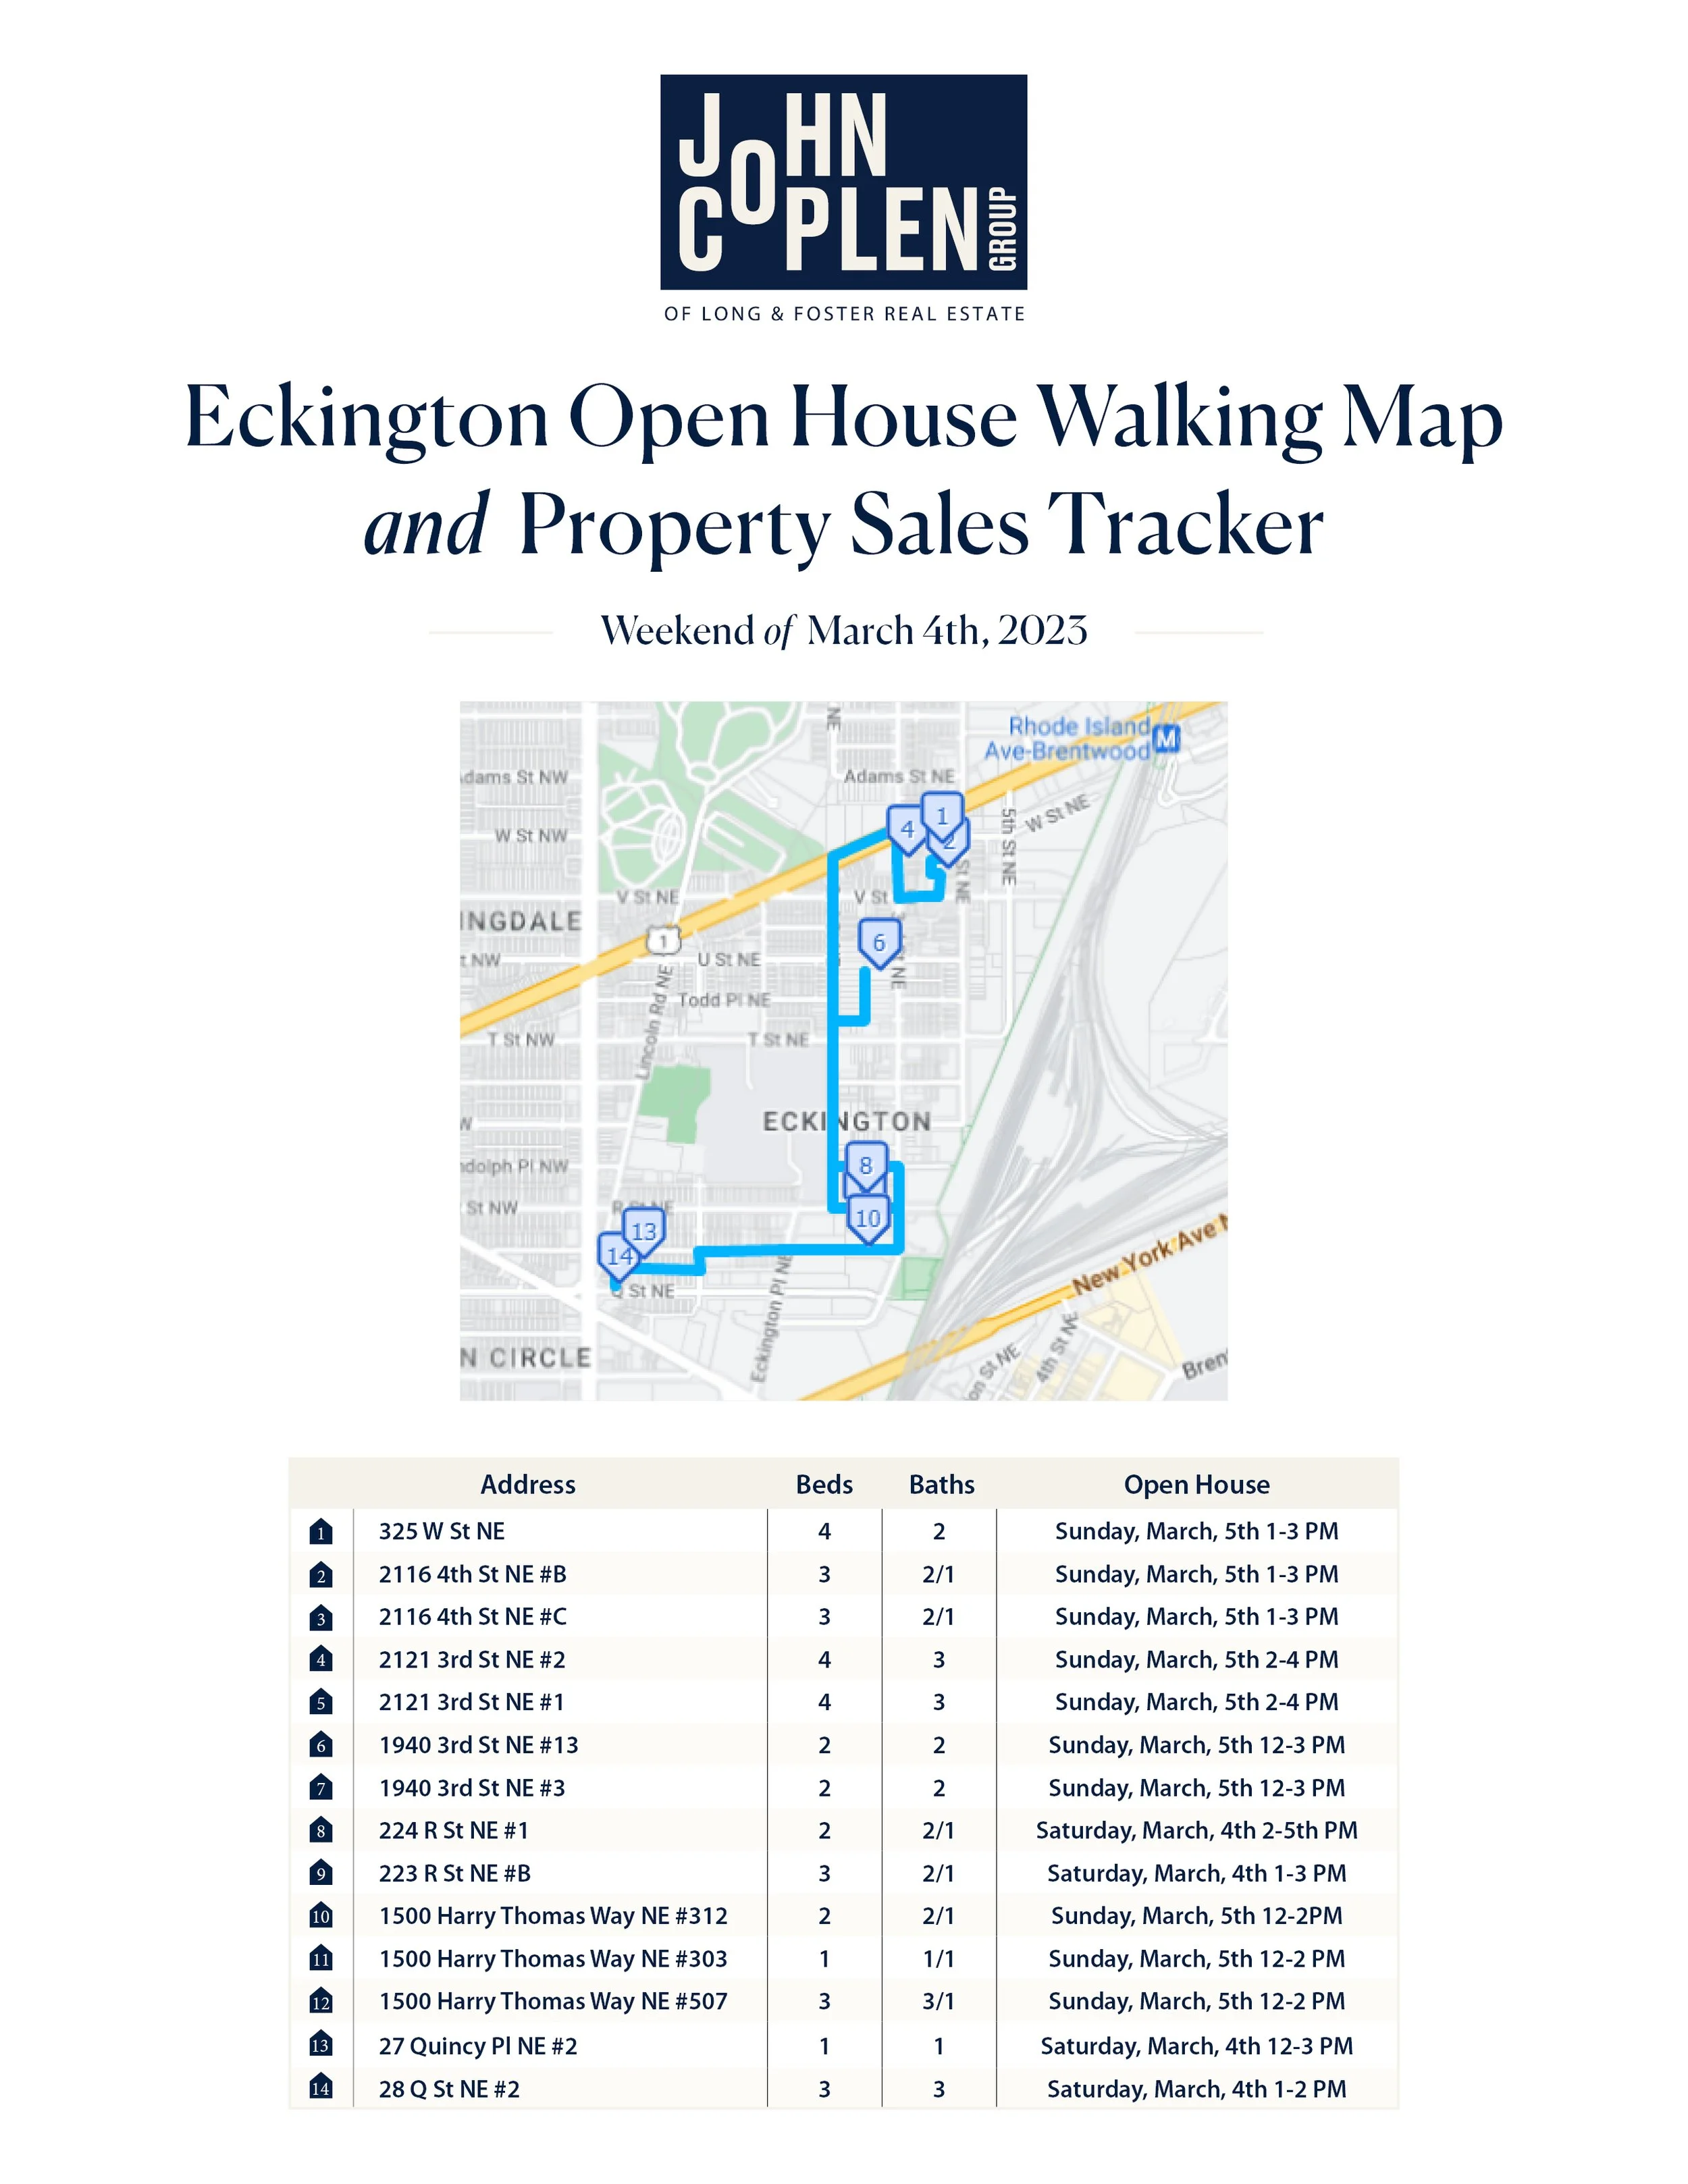
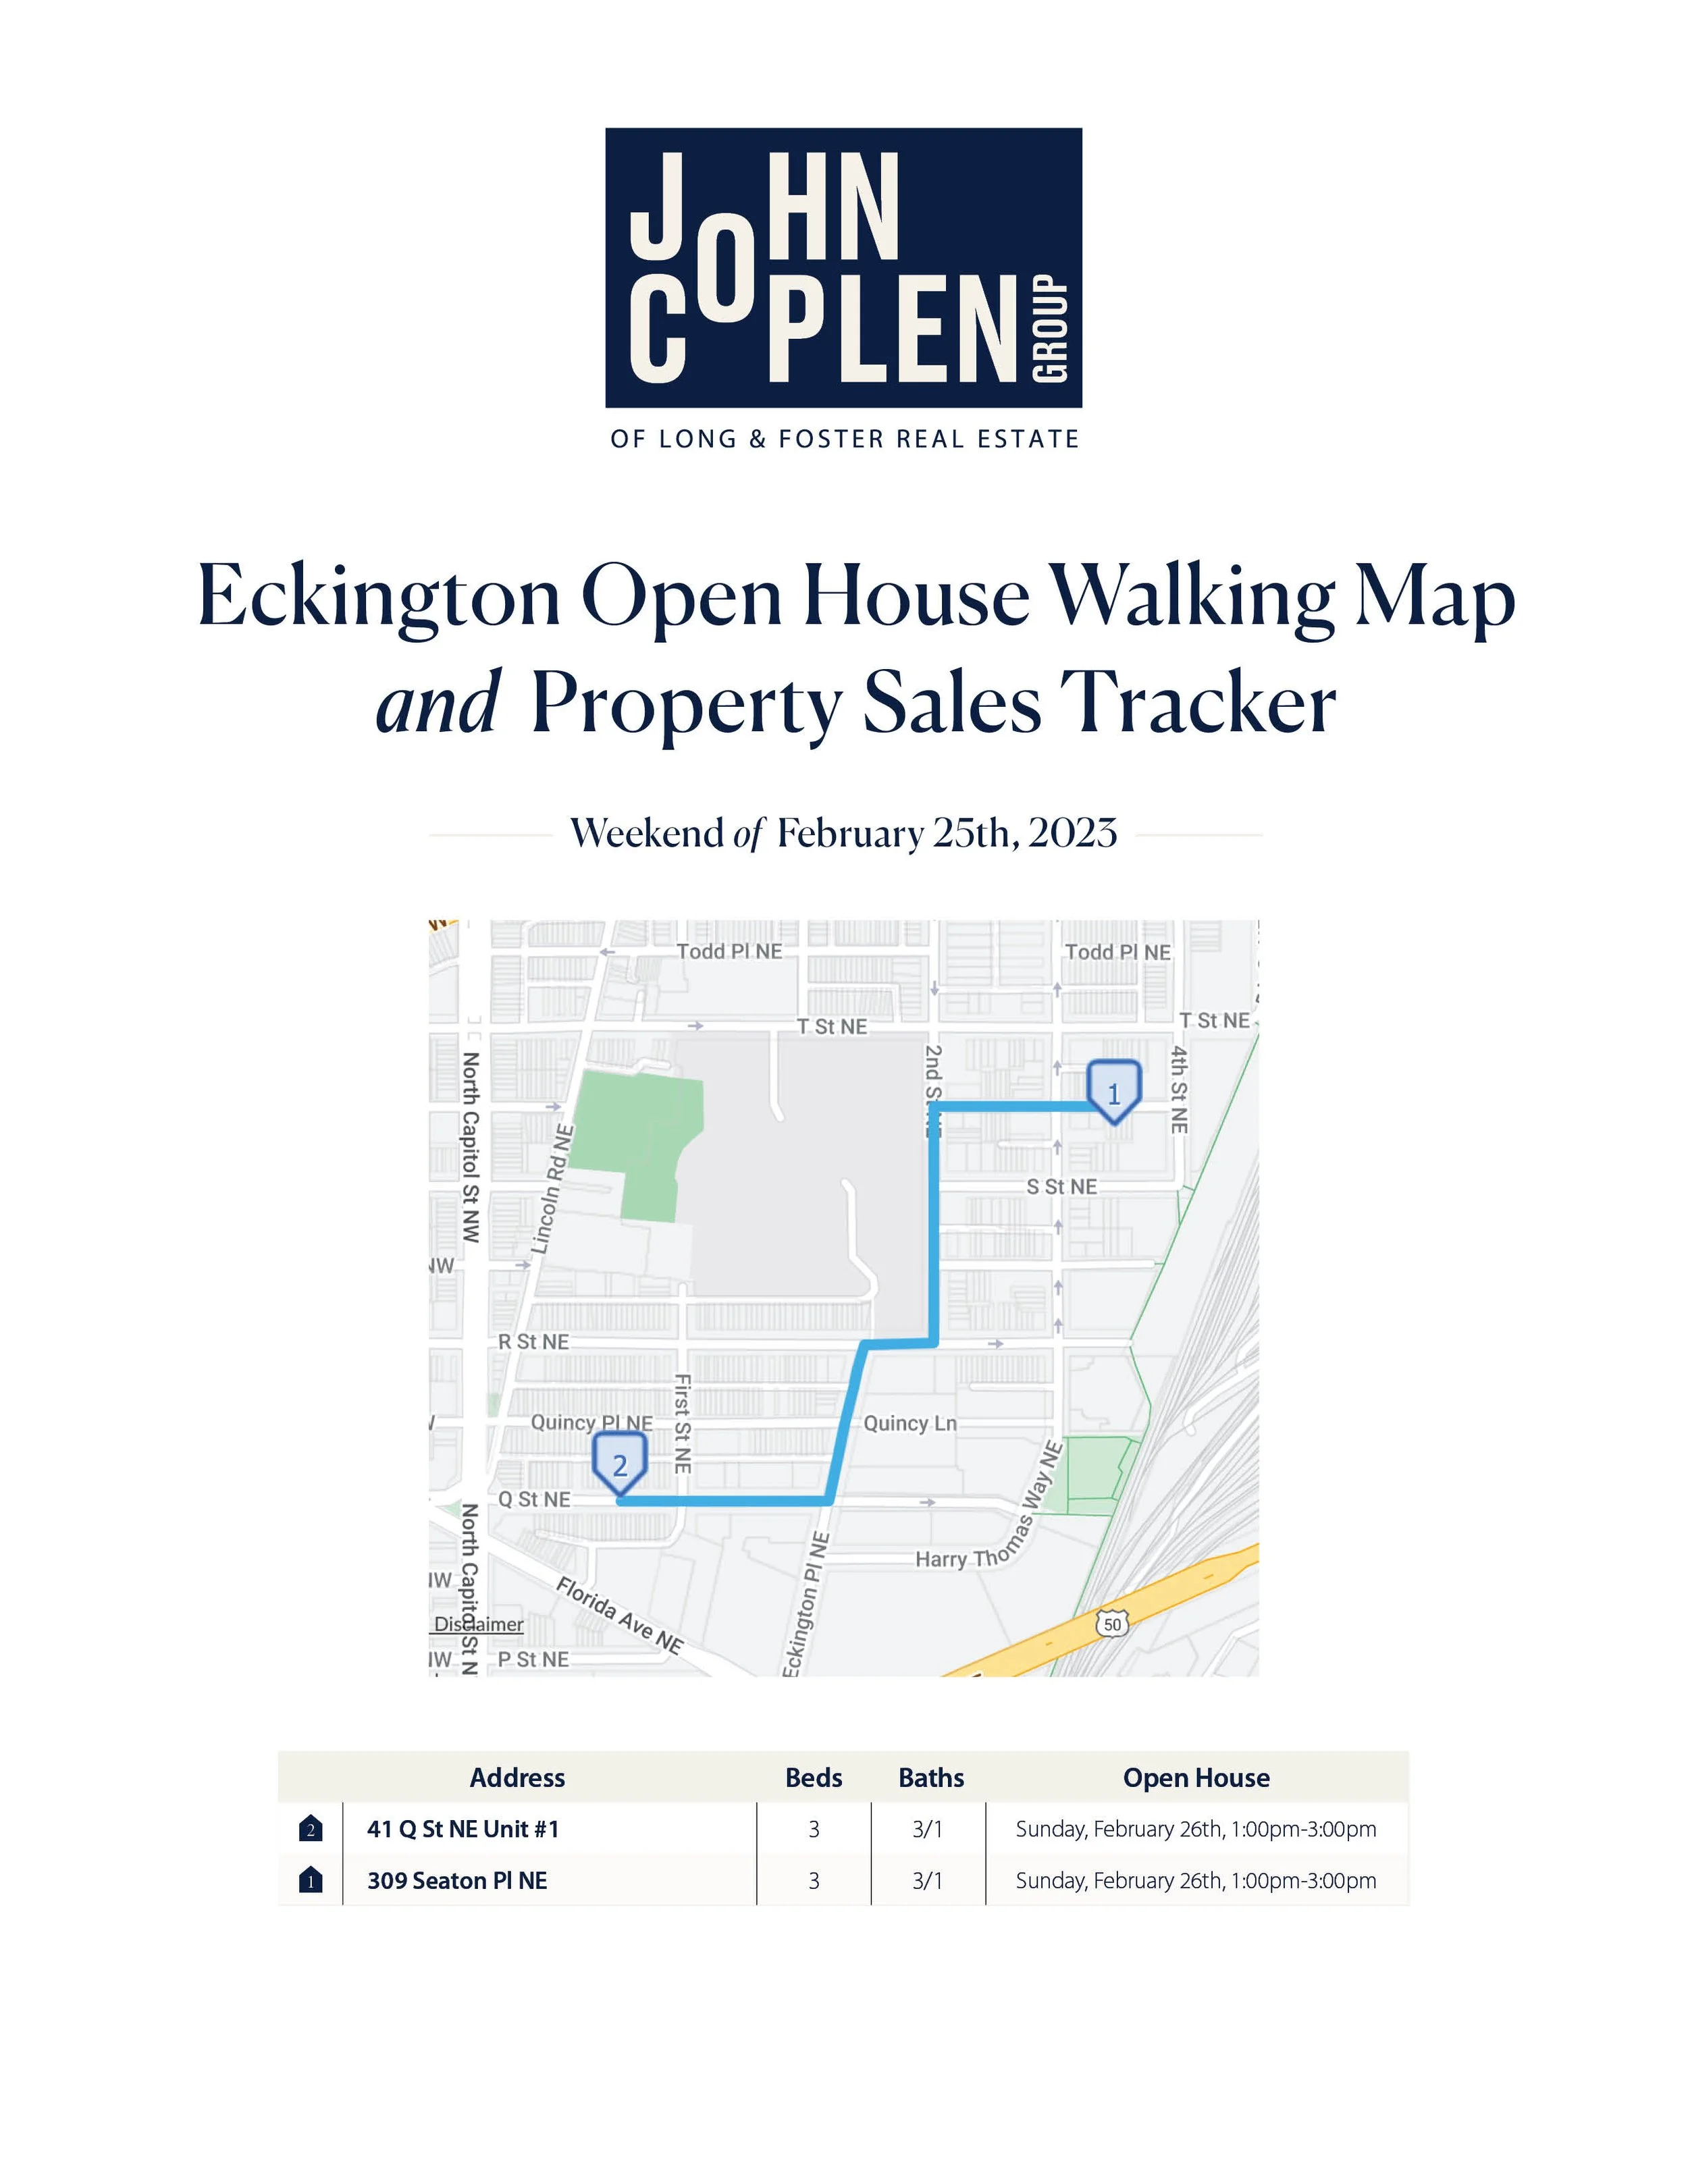
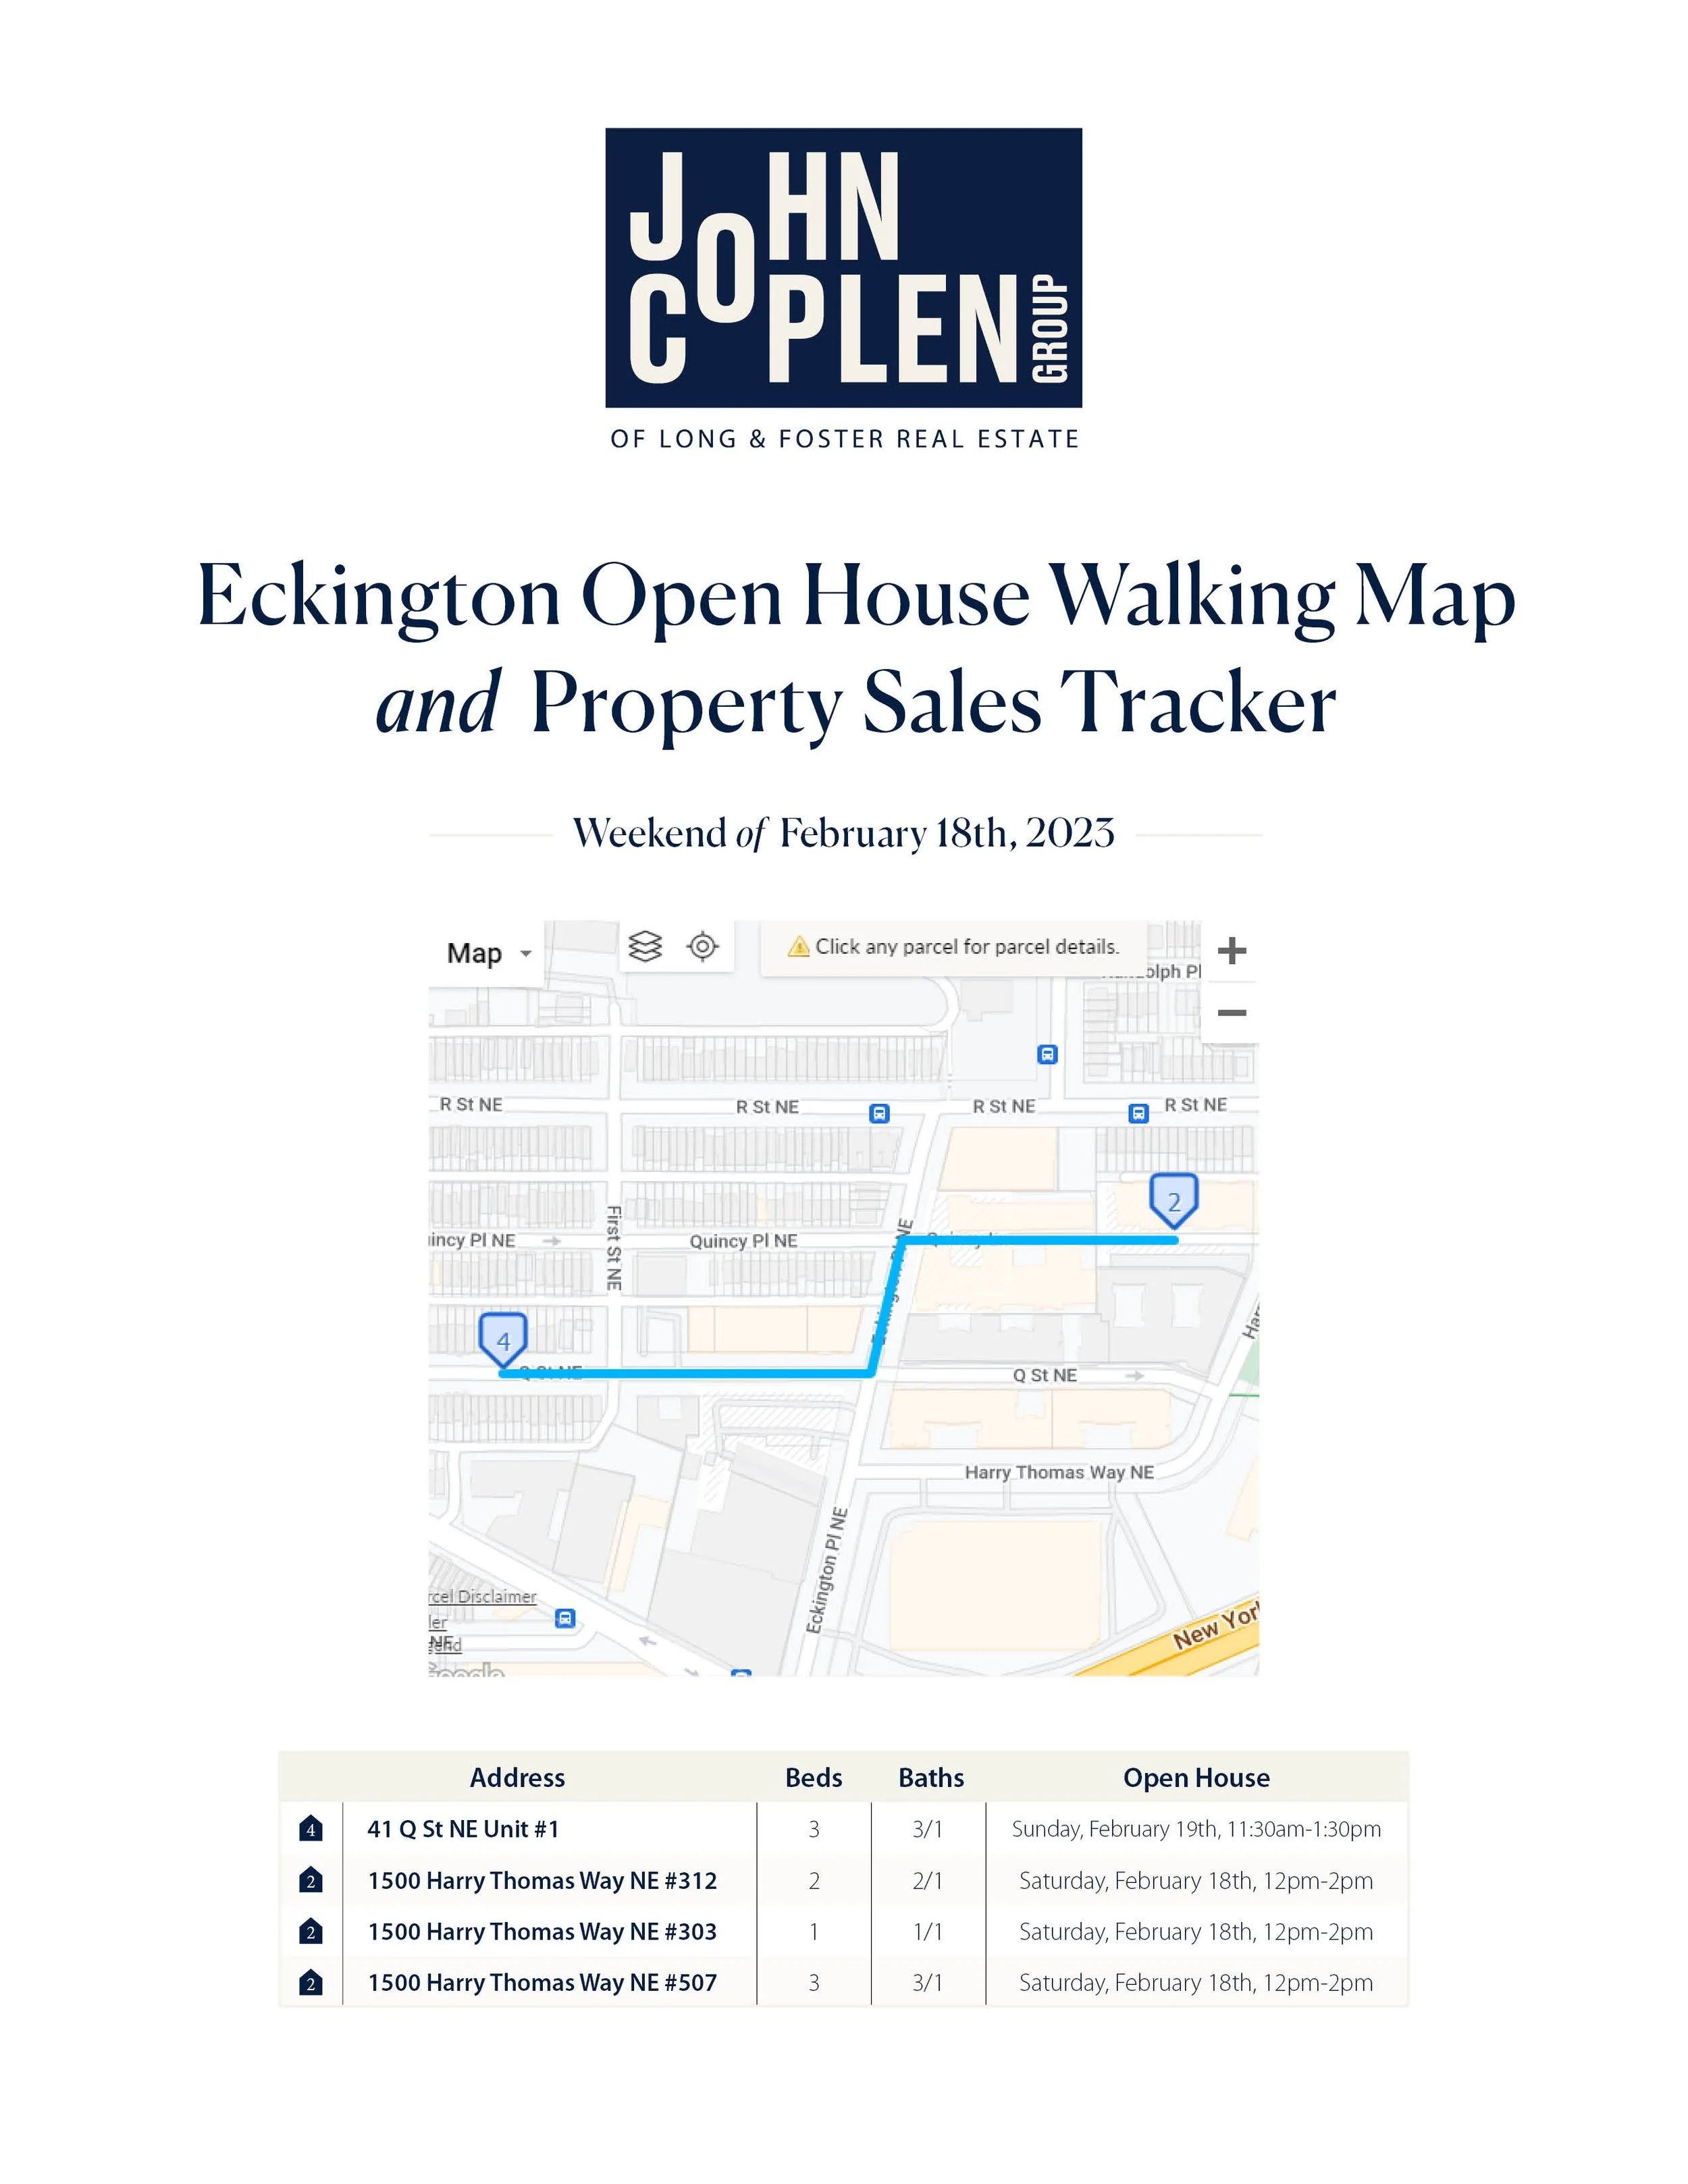
- DOWNLOAD - \\ ECKINGTON SALES TRACKER & OPEN HOUSE GUIDE // https://eckingtonproperties.com/TRACKER
- ACTIVE LISTING LINK - \\ TO ALL ACTIVE LISTED PROPERTIES IN ECKINGTON // https://EckingtonProperties.com/LiveLinkAllActive
- SUBSCRIBE - \\ TO HAVE TRACKER EMAILED TO YOU WEEKLY //https://EckingtonProperties.com/SUBSCRIBE
*Bright MLS has the borders incorrect. It incorrectly includes a section south of Florida in the MLS. Alex and I are working to try to get this resolved. It's only an issue for the live link not in our data tracking.
Thank you,
John